🏃 Marathon pace chart: anticipate your pace and passage times
Whether you’re aiming for a time or just want to finish your first marathon, one thing’s for sure: pace is the key to getting to the finish line without blowing up.
But how do you know whether you should be running at 6 minutes, 6 minutes 30 or 7 minutes per kilometer? And above all, how do you stick to it from start to finish?
👉 That’s where the marathon pace chart comes in.
It lets you visualize, anticipate and manage your pace over 42.195 km.
In this article, you’ll find ready-to-use charts for 5 objective times (from 3h to 5h), tips on how to use them effectively, and even a bonus to turn your marathon rp into a printed souvenir with The Post Trace.
🧭 What is the purpose of a marathon pace chart?
Understanding pace: min/km, km/h, passage time
Pace is the time it takes you to cover 1 kilometer. It is expressed in min/km.
For example, a pace of 6:00 min/km means that it takes you 6 minutes to run 1 km. Conversely, speed (in km/h) is more common among cyclists.
Another important concept is passage times. They indicate when you should pass key points on the course (5 km, 10 km, half-marathon, etc.) if you keep to your planned pace.
👉 A gait chart brings these three elements together to give you a clear view of your run.
Marathon pace simulator based on your target time
Passage time every 5 km
Why visualizing your pace helps you manage your run better
Running a marathon isn’t just about putting one foot in front of the other for 42 km.
Above all, it’s about managing your effort over time. Too fast at the start? You risk hitting the wall in the 30th km. Too slow? You’ll end up frustrated.
The speed chart becomes your compass. It helps you :
Keeping a steady rhythm
Adjust as you go
Anticipating key moments
It’s as much a mental tool as a physical one: see where you are, know where you’re going.
Predicting your pace = avoiding explosions
Marathon runners who explode rarely do so because of a lack of training, but rather because of poor pace management.
The board helps you avoid this. It becomes a reassuring ally, especially for a first marathon. It tells you:
If you’re ahead of schedule or behind schedule
If you need to slow down, maintain, or relaunch
That everything’s fine… or that you need to adapt
💡 Tip: print out your chart and slip it into your belt or stick it on your watch to check it out during the race.
Marathon pace table
Marathon time | Pace (min/km) | Speed (km/h) |
---|---|---|
2:00 | 2:51 | 21.1 |
2:05 | 2:58 | 20.25 |
2:10 | 3:05 | 19.47 |
2:15 | 3:12 | 18.75 |
2:20 | 3:19 | 18.08 |
2:25 | 3:26 | 17.46 |
2:30 | 3:33 | 16.88 |
2:35 | 3:40 | 16.33 |
2:40 | 3:48 | 15.82 |
2:45 | 3:55 | 15.34 |
2:50 | 4:02 | 14.89 |
2:55 | 4:09 | 14.47 |
3:00 | 4:16 | 14.06 |
3:05 | 4:23 | 13.68 |
3:10 | 4:30 | 13.32 |
3:15 | 4:37 | 12.98 |
3:20 | 4:44 | 12.66 |
3:25 | 4:52 | 12.35 |
3:30 | 4:59 | 12.06 |
3:35 | 5:06 | 11.78 |
3:40 | 5:13 | 11.51 |
3:45 | 5:20 | 11.25 |
3:50 | 5:27 | 11.01 |
3:55 | 5:34 | 10.77 |
4:00 | 5:41 | 10.55 |
4:05 | 5:48 | 10.33 |
4:10 | 5:55 | 10.13 |
4:15 | 6:03 | 9.93 |
4:20 | 6:10 | 9.74 |
4:25 | 6:17 | 9.55 |
4:30 | 6:24 | 9.38 |
4:35 | 6:31 | 9.21 |
4:40 | 6:38 | 9.04 |
4:45 | 6:45 | 8.88 |
4:50 | 6:52 | 8.73 |
4:55 | 6:59 | 8.58 |
5:00 | 7:07 | 8.44 |
5:05 | 7:14 | 8.30 |
5:10 | 7:21 | 8.17 |
5:15 | 7:28 | 8.04 |
5:20 | 7:35 | 7.91 |
5:25 | 7:42 | 7.79 |
5:30 | 7:49 | 7.67 |
5:35 | 7:56 | 7.56 |
5:40 | 8:03 | 7.45 |
5:45 | 8:11 | 7.34 |
5:50 | 8:18 | 7.23 |
5:55 | 8:25 | 7.13 |
6:00 | 8:32 | 7.03 |
6:05 | 8:39 | 6.94 |
6:10 | 8:46 | 6.84 |
6:15 | 8:53 | 6.75 |
6:20 | 9:00 | 6.66 |
6:25 | 9:07 | 6.58 |
6:30 | 9:15 | 6.49 |
6:35 | 9:22 | 6.41 |
6:40 | 9:29 | 6.33 |
6:45 | 9:36 | 6.25 |
6:50 | 9:43 | 6.17 |
6:55 | 9:50 | 6.10 |
7:00 | 9:57 | 6.03 |
📊 Gait tables for 5 classic objective beats
Do you know roughly how long you’d like to finish your marathon?
These handy charts help you visualize your target pace, both in terms of pace (min/km), speed (km/h) and time taken to complete the main kilometers.
💡 Tip: print out your board or take a photo to use on the big day.
🎯 Marathon target: 5h00 (pace 7:07/km, speed 8.4 km/h)
Distance | Passage time |
---|---|
5 km | 35:35 |
10 km | 1:11:10 |
15 km | 1:46:45 |
20 km | 2:22:20 |
Semi | 2:30:14 |
25 km | 2:57:55 |
30 km | 3:33:30 |
35 km | 4:09:05 |
40 km | 4:44:40 |
42.195 km | 5:00:00 |
🎯 Marathon target: 4h30 (pace 6:23/km, speed 9.4 km/h)
Distance | Passage time |
---|---|
5 km | 31:55 |
10 km | 1:03:50 |
15 km | 1:35:45 |
20 km | 2:07:40 |
Semi | 2:15:36 |
25 km | 2:39:35 |
30 km | 3:11:30 |
35 km | 3:43:25 |
40 km | 4:15:20 |
42.195 km | 4:30:00 |
🎯 Marathon target: 4h00 (pace 5:41/km, speed 10.6 km/h)
Distance | Passage time |
---|---|
5 km | 28:25 |
10 km | 56:50 |
15 km | 1:25:15 |
20 km | 1:53:40 |
Semi | 2:00:20 |
25 km | 2:22:05 |
30 km | 2:50:30 |
35 km | 3:18:55 |
40 km | 3:47:20 |
42.195 km | 4:00:00 |
🎯 Marathon target: 3h30 (pace 4:58/km, speed 12.1 km/h)
Distance | Passage time |
---|---|
5 km | 24:50 |
10 km | 49:40 |
15 km | 1:14:30 |
20 km | 1:39:20 |
Semi | 1:45:30 |
25 km | 2:04:10 |
30 km | 2:29:00 |
35 km | 2:53:50 |
40 km | 3:18:40 |
42.195 km | 3:30:00 |
🎯 Marathon target: 3h00 (pace 4:15/km, speed 14.1 km/h)
Distance | Passage time |
---|---|
5 km | 21:15 |
10 km | 42:30 |
15 km | 1:03:45 |
20 km | 1:25:00 |
Semi | 1:29:45 |
25 km | 1:46:15 |
30 km | 2:07:30 |
35 km | 2:28:45 |
40 km | 2:50:00 |
42.195 km | 3:00:00 |
These benchmarks help you to stay on course during the race, without relying solely on your watch.
You can even adapt them to your own goal if you’re aiming for 4:15 or 3:45, by interpolating the data.
🎯 How to use these tables before and during the race
🏃 Before the race: a valuable training tool
Pace charts aren’t just for D-day. You can use them throughout your preparation to :
Test your target pace on long outings
Validating your goal after a half-marathon
Get used to the pace you’ll have to keep up for 3, 4 or 5 hours
For example, if you’re aiming for 4h30 (6:23/km), add 30 to 45-minute portions at this pace to your long sessions.
💡 Goal: make this pace natural and comfortable.
🕐 D-Day: a practical guide to help you get off to a good start
At the start of a marathon, between the adrenalin and the other runners, everything pushes you to go too fast.
The pace table helps you stay on course, especially :
At crossing points every 5 km
The half-marathon, often decisive
Moments of doubt (30th, 35th km)
You can compare your actual time with the planned theoretical time. If you’re ahead: slow down a little. If you’re late: don’t panic, just stay on schedule.
🧠 Adapt your pace to the reality of the terrain
The painting gives you a framework, but it doesn’t replace your sensations.
Sometimes it’s hot, sometimes it’s raining, sometimes the course climbs… In these cases:
Keep a safety margin
Listen to your body
Don’t go for the clock at all costs
What counts is finishing well, not blowing up over 3 minutes gained.
💡 Practical tip: print out your chart or stick it on your watch
You can also pin it to your belt or write it on your forearm with a permanent marker.
It will become your silent co-pilot during the race.
⌚ Differences between average, instantaneous and real pace: don’t be fooled
🎢 Instantaneous allure: unstable data
When you run with a GPS watch, it often displays your pace in real time.
But beware: this data is often false or unstable, especially :
In tunnels, under trees or between buildings
If you zigzag or slow down slightly
If the GPS signal is weak or offset
👉 Result: you can see your pace “jump” from 5:50 to 6:20/km… even though you’re running perfectly steady.
📊 The average pace: more reliable… but to be interpreted
The average pace displayed on your watch is calculated since the start of the race.
It is useful for keeping an overview, but it also smoothes out any gaps:
Are you fast for the first few kilometres? She goes downhill
Do you flinch at the end? It won’t come up fast enough to alert you
💡 Example: if you’re aiming for 4:30, your average pace should be around 6:23/km. If it exceeds 6:35/km after the 30th, it becomes complicated to catch up.
🕰️ The transit table: the only objective indicator
The most reliable is still… your time at the milestones.
By comparing your real time with the one on the pace board, you know exactly :
If you’re on the ball
If you need to slow down, speed up or maintain
👉 That’s why paintings remain an indispensable complementary tool to the watch.
🖼️ And after the race? Turn your pace into a memory with The Post Trace
🎉 Your look tells your story
Every runner experiences his or her marathon differently. Whether you ran in 3 hours 10 minutes or 5 hours 45 minutes, whether you kept to your pace or adjusted your plan along the way, your track record is unique.
👉 Your pace isn’t just a number.
It’s your rhythm, your emotions, your highs, your lows. It’s what makes your run an unforgettable memory.
🧭 Visualize your performance on a customized poster
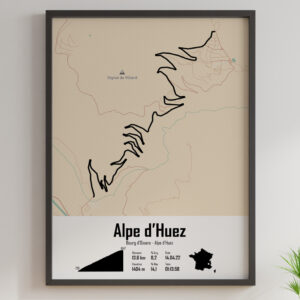
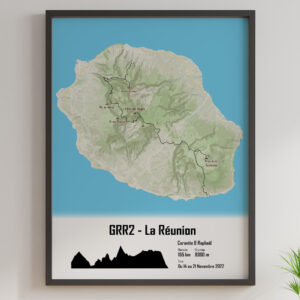
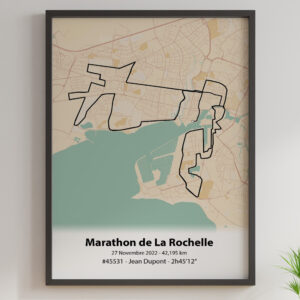
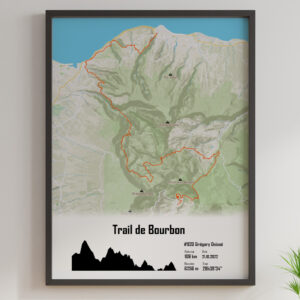
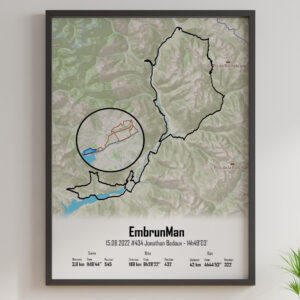
With The Post Trace, you can turn your marathon into a unique finisher’s poster displaying :
The exact GPS route you took
Your total time and average pace
Symbolic milestones (half, 30th km…)
A personalized title (“Mon 1er marathon à Lyon – 4h28 de bonheur”)
Photos, if you wish
Printed on high-quality paper, aluminum or wood, it becomes a proud object to display in your home.
🎁 A gift for yourself… or for someone else
Have you just finished your first marathon? Have you accompanied a loved one to the end?
The gift of a personalized The Post Trace poster is :
Anchoring the emotion of the race in reality
Celebrating effort and resilience
Keeping track of the pace that carried you through to the end